
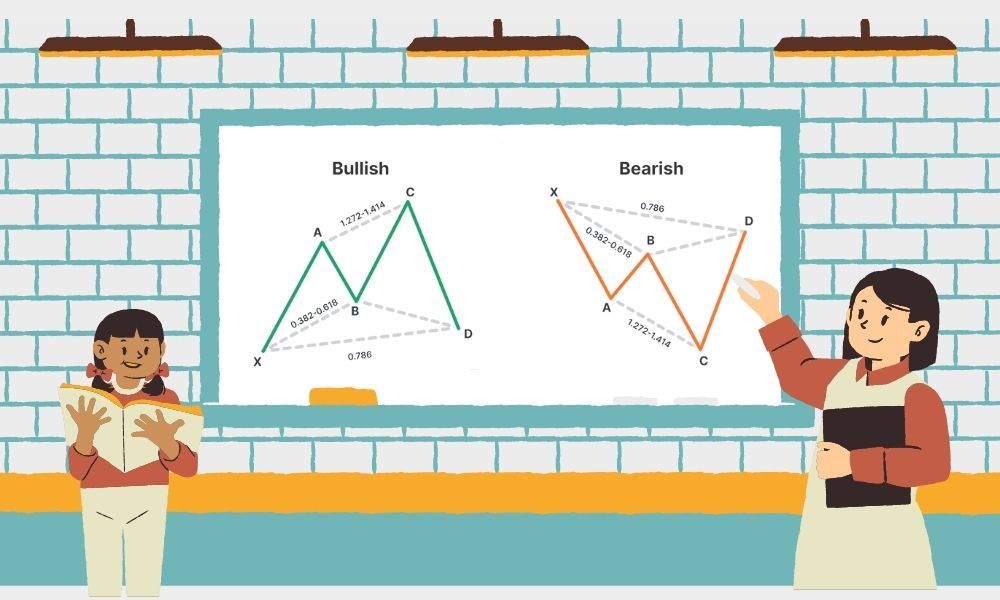
Recognise recurring structures
Harmonic analysis examines geometric price formations alongside Fibonacci retracements and extensions. The source introduces Gartley, Butterfly and Bat patterns as different ways to organise potential turning areas.
Check the ratios
The article discusses measuring retracements and extensions instead of relying only on a familiar-looking shape. Charting tools can help compare swings and identify areas that merit closer examination.
Test before relying on a setup
The source also discusses backtesting, confirmation and planning entries and exits. A completed pattern represents an interpretation of price behavior, rather than proof that a reversal will occur.
Start with measurements that another reader can reproduce
A pattern study becomes clearer when every selected turning point is labelled and its price recorded. The reader should be able to recreate the measurements from the notes without guessing which candle was intended. Specify whether the study uses intrabar extremes or closing prices. A visual resemblance can be the beginning of an investigation, but the measurement rules determine whether two examples actually belong to the same group.
An example of retracement arithmetic
Imagine a fictional price move from 100 to 120 followed by a return to 110. The original move spans 20 units and the return spans 10, so the retracement is 10 divided by 20, or 50 percent. This calculation explains the measurement process without declaring that the sequence forms a particular harmonic pattern. Pattern names require additional observations and definitions; one ratio alone cannot establish the full structure or the direction of the next move.
Choose tolerances before reviewing outcomes
Real charts rarely resemble idealised drawings exactly. If a research method accepts a range around a target ratio, define that range before examining whether a trade would have won. Otherwise an analyst can keep widening the acceptable measurements until a preferred outcome fits. Store the chosen tolerance alongside the example. A later change to that rule should be tested on a separate sample rather than applied selectively to charts that were difficult to classify.
Keep pattern recognition separate from execution research
Identifying a candidate structure does not settle where an entry occurs, how an order executes or when the idea is invalidated. Those are additional rules that should be stated explicitly in a simulation. Compare a completed-pattern rule with a confirmation rule as separate methods, rather than switching between them after seeing price action. This makes the review more transparent and reveals whether an apparent improvement came from the definition of the setup or from a different execution assumption.
Evaluate the method beyond attractive examples
Keep a chronological record that includes rejected candidates, ambiguous shapes and failed reversals. Separate examples used to develop the rules from examples reserved to evaluate them. Include realistic transaction assumptions and record how much interpretation each chart required. A pattern that looks persuasive in a selected screenshot may be difficult to recognise consistently in real time. The useful outcome of the exercise is a documented research process, not a claim that Fibonacci measurements guarantee market turning points.