
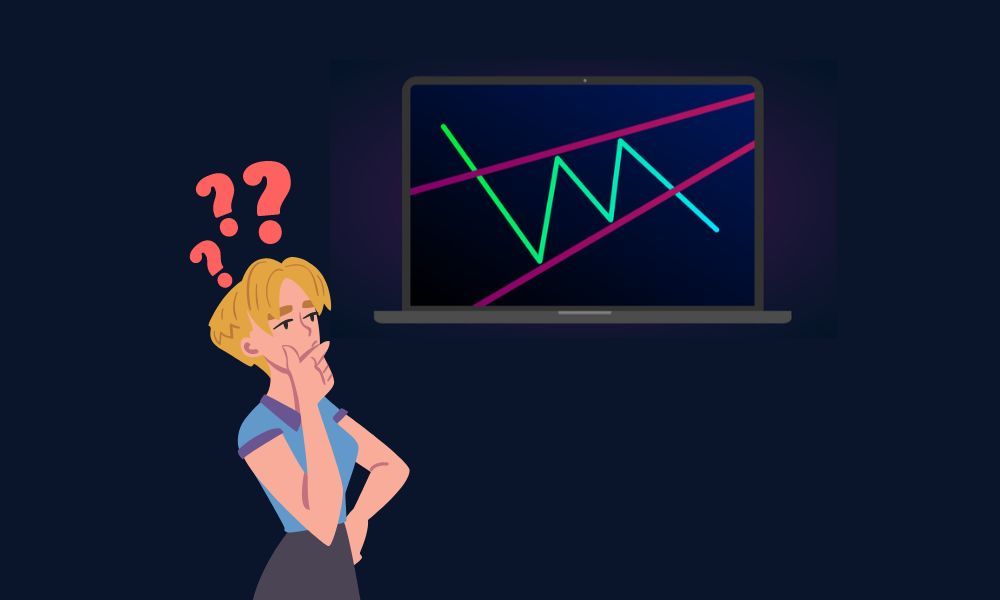
Identify the shape
A rising wedge has higher highs and higher lows inside two upward-sloping lines that converge. The lower boundary climbs more steeply than the upper one, so the trading range narrows.
Watch the lower line
The source treats weakening participation and a break below support as signs of a possible bearish reversal. It also distinguishes wedges from triangles whose upper boundary may be horizontal.
Keep the interpretation conditional
The article notes that identifying the formation in real time can be difficult. Context and an actual boundary break matter; the outline of a wedge does not guarantee the next price move.
Write down the construction rules
Two people can draw different wedges on the same chart when they use different swing points. A more reproducible study specifies the timeframe, whether lines connect wicks or closes, and which observations qualify as turning points. Record those choices before looking at the eventual result. This avoids redrawing a formation until it appears to explain an outcome that was already known. A chart annotation should remain a testable description of price.
A fictional narrowing sequence
Suppose successive lows appear at 100, 103 and 106 while successive highs occur at 110, 112 and 113. Both series rise, but the gap between the boundaries becomes smaller. That arithmetic helps illustrate convergence without relying on a perfect textbook drawing. It does not identify a real trading opportunity. Changing the selected swings could produce a different shape, which is why the choice of observations belongs in the research notes.
Distinguish a developing shape from a completed event
A narrowing formation can continue developing for longer than expected. Naming it does not establish when a boundary will break. For a chart study, define whether a break means a brief trade beyond the line or a close outside it. Then document the same event definition for every example. If price later returns inside, retain that observation rather than quietly reclassifying the original chart as a different pattern.
Compare the surrounding chart
Context notes can include the direction of the preceding move, nearby turning points and the chart interval. These notes describe the environment; they do not supply a certainty score. A shape visible on a short interval may be only a small part of a wider range on a longer chart. Comparing the two views can reveal why analysts disagree without assuming either drawing predicts the next move. Keep the original interval visible in saved examples.
Build a balanced pattern journal
A useful journal includes cases that never broke, cases that broke and recovered, and cases that continued lower. Record the same fields for all of them so the review does not reward hindsight. If the method requires repeatedly changing boundaries after the fact, that is a reason to revisit its definitions. The practical goal is clearer observation and more consistent testing, rather than finding a chart label that makes every past move appear predictable.